
Fundamental analysis of PSP Projects
1. Company and its industry
2. Management and its business model
3. Fundamentals
4. Growth
5. Valuation
————————————————
Company
Overview - PSP Projects Limited is a multidisciplinary construction company offering a diversified range of construction and allied services across industrial, institutional, government, government residential and residential projects in India. It was founded in 2008.
Milestones -

Credit Rating -

Subsidiary -

Share holdings pattern -

Manpower -

Industry
Indian construction industry -
* The construction industry of India is 2nd largest employment provider.
* It contribute 9% to the national GDP.
* The government plans to invest about ₹100 lakh crore in the infrastructure sector over next 5 years.
* The construction industry in India is expected to become the 3rd largest globally by 2022.
* The growth is driven by current and planned spends on highways, railways, ports, airports and urban infrastructure.
* The growth of the industry - 

* Indian construction output -

Industry structure & development -
* Industrial construction segment -
1. Construction within the institutional and infrastructure space in India has many governments initiatives in its favour programs such as Bharatmala Pariyojana, a nation wide road and highway network project that aims to create 9000 km of economic corridors.
2. Under the Pradhan Mantri Gram Sadan Yojana, the government aims to build roads in the rural and backward areas of the country. In union budget 2020-2021, ₹1.7 trillion has been provided for transport infrastructure.
3. 6,500 social and economic projects across sectors under the national infrastructure pipeline are expected to get an investment of more than ₹100 trillion over the next 5 years.
Institutional construction segment -
1. The institutional construction market will be supported by public and private sector investment in education & healthcare projects.
2. The government increased its expenditure on the education sector by 10.4% and 16.3% on healthcare.
Residential construction segment -
1. According to the Global data experts, the residential construction market to retain its leading position and account for 30% of the industry total value by 2023.
2. Market expansion is expected to be supported by the public and private sector investment in the construction of new residential buildings in order to meet the demand for housing.
3. The government allocated ₹1 trillion to construct affordable houses in the country by 2020.
Commercial construction segment -
1. India’s commercial realty market has been on a upswing with well managed, high quality properties with an average tenancy of three years and nearly 90% stable occupancy and good cash-flow visibility.
2. IT, retail, E-commerce have registered a high demand for office space in recent time.
3. A commercial real estate remain a trend that is likely to see 5-10% escalation per annum.
Management
Management talks -
* Indian economic drivers -
1. Democratic setup
2. Demographic profile
3. Ease of doing business
4. FDI
5. Industrial investment
6. Smart cities & Urbanisation
7. Make in India & Digital India
* Opportunities -
1. Housing for all
2. Policies reforms
3. Government initiatives
4. Growth compulsion
5. Industrial corridors
6. Growing availability of finance for end-users.
* Threats -
1. Infrastructure safety
2. Economic & Political instability
3. Uncertainties
4. Natural Calamities
* Risks & Concerns -
1. Economic cycle
2. Dynamic economic and political developments
3. Competition risk
4. Financial risk
5. Technologies risk
* Outlook of the Industry - India is expected to become the 3rd largest construction market globally. There is immense scope of growth.
* Performance analysis of Management -
1. ROA - 15.3 ( it should be more than 10 )
2. ROE - ( it should be more than 15 )


Business Model
* Category-wise Revenue break up -

* Revenue from Operations -

* Sector-wise Revenue break up -

* Region-wise Revenue break up -

Fundamentals
1. Market capitalisation - 1508 crore
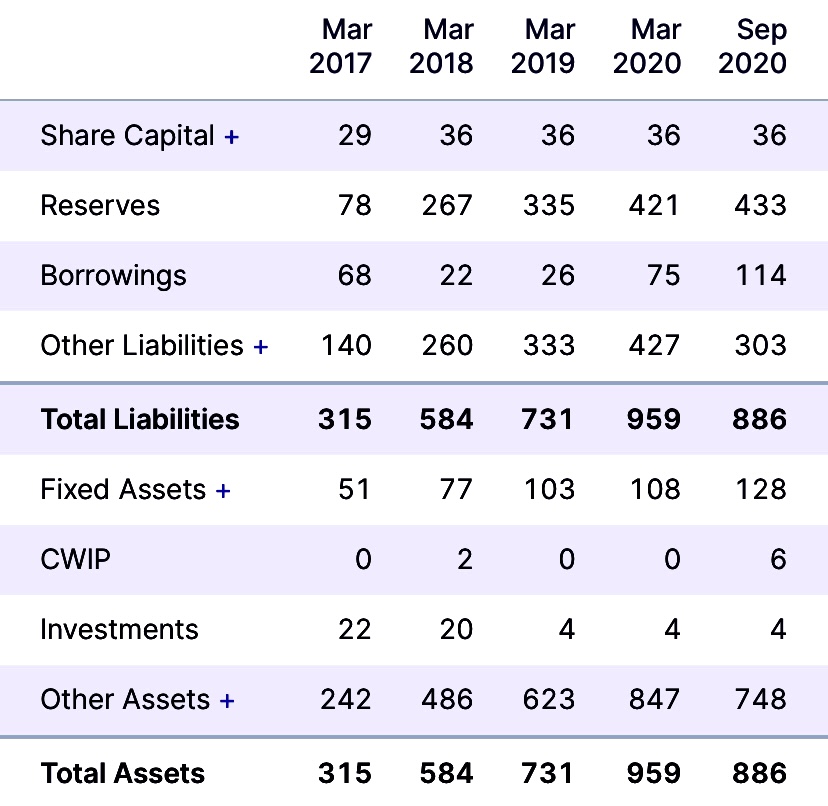
2. Balance sheet -
3. Current ratio - 1.39 ( it should be more than 1.33)
4. Debt to equity - 0.24 ( it should be less than 1)
5. Interest coverage ratio - 12.92 ( it should not be less than 1 )

7. Cash flow to Profit Ratio - 0.48 ( it should be more than 1 )
Growth
1. Sales Growth -

2. Profit Growth -

3. Share-price Growth -

4. Order book -

5. Projects completed -

Valuation
1. PE ratio - 20
2. Industry PE ratio - 16.6
3. PB ratio - 3.21 ( it should be less than 3)
4. PEG ratio - 0.35 ( it should be less than 1)
5. 5 year profit growth - 3x
6. 5 year share price growth - 2x
7. Intrinsic value formula ( by Benjamin graham) - ₹1828
# intrinsic value formula:-(2*G + 8.5) * EPS
Where G stand for growth(5years)
EPS stand for earn per share
——————————————————————
Thank you for reading
Comments
Post a Comment