Fundamental Analysis of Racl Geartech
1. Company and its industry
2. Management and its business model
3. Fundamentals
4. Growth
5. Valuation
————————————————
Company
Overview - RACL is established in 1989 for producing automotive components in the field of motorcycle & scooter, 3&4 vehicles, cargo vehicles, agriculture machinery, tractor, ATV, light & heavy commercial vehicles, etc.
* Share- holding pattern -
*Subsidiary -
RACL Geartech GmbhH ( Austria) || 100% holding.
* Extra information
1. CSR expenditure - 20.55 lakhs
2. Salary to employees - 24.82 crore
Industry
* India is the 5th largest auto market in the world.
* India is the 7th largest manufacturer of commercial vehicles.
* The Indian auto components industry has experienced healthy growth over the last few years
* In 2018-2019, the turnover of the Indian auto components industry was 3,95,902 crore. Its contribution to GDP is 2.3% and to manufacturing GDP is 25%.
* Peers -
Management
Management talks -
* Opportunities -
1.Although, post COVID crisis, the short-term demand shall have an adverse effect on Automotive demand patterns across the industry, but in the long term, post Covid era shall open up huge opportunities for the Indian auto components sector to become the factory of the world.
2.It is widely expected that even the Global customers shall shift their focus from East Asian Countries to India. Hence, demand of Export of Auto components from India is set to grow manifolds. Manufacturers who are already exporting to Western countries, shall become the first choice of prospective buyers. RACL has a leading edge in this aspect also, as we have a well-established connect with major European & American OEMs with unblemished track record of over a decade.
3.RACL shall have huge opportunity in improving its penetration in the domestic market because of majority of product base having presence in 2-wheeler and 3 wheeler segment.
* Threats, Risk & Concerns -
1. More than ever before, today, the automotive industry is in a state of constant pressure. Customers are demanding new and stringent quality norms – often without showing willingness to pay additional cost.
2. Advancement in Vehicle technologies & increasing customer expectations, is putting tremendous pressure on component manufacturers to invest continually on advanced manufacturing processes, which, in turn requires heavy Capital Investments.
* Return on Assets - 10.5
* Return on equity -
* Return on Capital employed -
Business Model
* Revenue from Business segment -
* Revenue from operation -
Fundamentals
1. Market capitalisation - 297 crore ( Mirco-Cap)
2. Balance sheet -
3. Current Ratio - 1.24
4. Debt to equity - 0.84
5. Interest coverage Ratio - 3.60
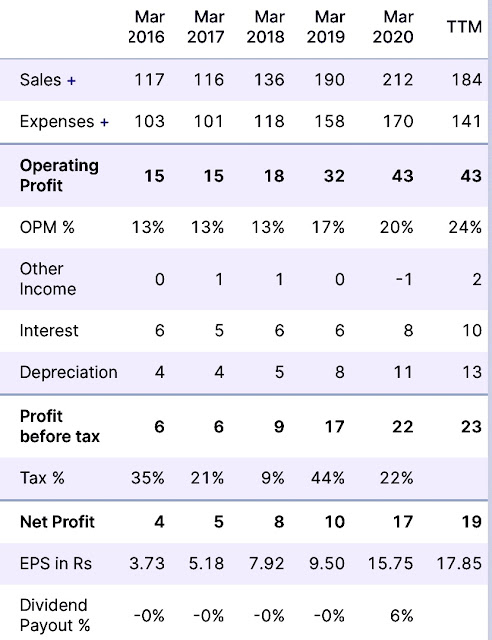
6. P&L statement -
7. Cash flow to profit Ratio - 1.72
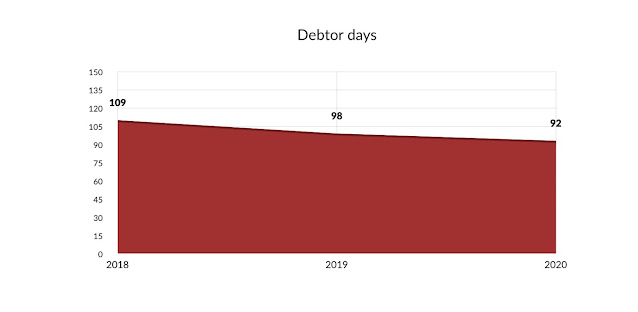
8. Debtor days -
1. Sales Growth -
2. Profit Growth -
3. Share price Growth -
Valuation
1. P.E Ratio - 15.4
2. Industry P.E Ratio - 33.2
3. P.B Ratio - 3.23
4. PEG Ratio - 0.41
5. 5 year profit Growth - 4.75 x
6. 5 year share price Growth - 10.38 x
7. Intrinsic Value Formula - ₹ 1222
# intrinsic value formula:-(2*G + 8.5) * EPS
Where G stand for growth(5years)
EPS stand for earn per share
——————————————————————
Thank you for reading


Very Impressive!Thanks for the post. We are Auto Components Manufacturers in India.
ReplyDelete