
Analysis of Alkem laboratories
1. Company and its industry
2. Management and its business model
3. Fundamentals
4. Growth
5. Valuation
--------------------------------------------------------------------------
Company
Overview - Alkem laboratories is established in 1973.Alkem Laboratories Limited is an Indian multinational pharmaceutical company headquartered in Mumbai, Maharashtra, India that manufactures and sells pharmaceutical generics, formulations and nutraceuticals in India and globally.
Milestones -


* Subsidiary -


* Share holdings of the company -

* Extra information -
1. R&D expenditure - 5.7 % of the revenue.
2. CSR expenditure - 1.14 % of the profits.
3. Employees - 14331.
4. Salary to employees - 1505.5 crore.
5. Credit rating -

* The global pharma industry is one of the largest and the oldest industry in the world. The global pharmaceutical industry is estimate to be US$ 1.25 trillion in 2019.
* The pharmaceutical industry is expected to grow at a cagr of 3-6% over 2020-2024 to touch US$1.6 in 2024
* key treads driving the growth -
1. Ageing and rising population.
2. Prevalence of lifestyle diseases.
3. Growing middle - class people income.
4. Low priced generics.
5. Innovation.
* Review of the market -
* Developed market - In the developed market, medicine spending reaches to US$ 821.6 billion in 2019. The developed market are expected to see a average cagr between 2-5 through 2024 to reach total spending 985-1015 billion dollar.
* Pharmerging market or developing world- IN 2019,pharmerging market comprise 26% of the global spending at net market price. Pharmerging market are expected the growth of 5-8% over 2020-2024.
* Indian pharmaceutical industry(IPM)-
1. Over the past five years through 2014-2019, Indian pharmaceutical market has been one of the fastest growing market in the world.
2. As per IQVIA, IPM to grow at a CAGR of 8-11 over 2020-2024 to reach 31-35 billion US dollar in 2024. Which is double the rate of growth when compared to its global peers.
3. As per IQVIA, the turnover of IPM reaches 22 billion US dollar in 2019-2020, a growth of 10.8 from the previous year.
4. Growth in domestic pharma-market is also expected to be supported by the government focus on enhancing access to heathcare to economically weaker section of the society.
5. After COVID-19 impact, The Indian government has decided to set up 1 lakh crore fund to encourage companies to manufacturing pharmaceutical ingredients domestically and make India self-reliant in the manufacturing of bulk drugs.(otherwise India pharmaceutical industry import 70% of its API from china.
Management
Management talk -
* Domestic Business -

Outlook for Domestic business -
1. As per IQVIA report, the Indian pharmaceutical market is expected to be one of the fastest growing pharmaceutical market in the world.
2. The government is also increasing its investment towards the healthcare sector with initiatives like Ayushmann Bharat Pradhan mantra jan aarogya Yojana and Jan Aushadi kendras etc.
3. There is a good visibility of growth for the Indian pharmaceutical industry over the medium to long term horizon.
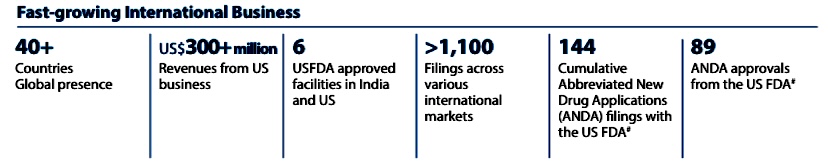
* US business -

Outlook of US business -
1. The US continue to be the largest pharmaceutical market in the world.
2. The US business has demonstrated sustained growth over the last ten years, making it indispensable to the company’s global sale.
3. The company is focused to grow its US business.
* Other international market -

* Besides India & and the US, the company has wide presence in more than 40 international market with its key market being Australia, Philippines, Chile, Kazakhstan.
* Outlook - The company thrives to grow at similar pace in the other international market as it has grown in its key market.
* ROA - 15.4
* ROE -


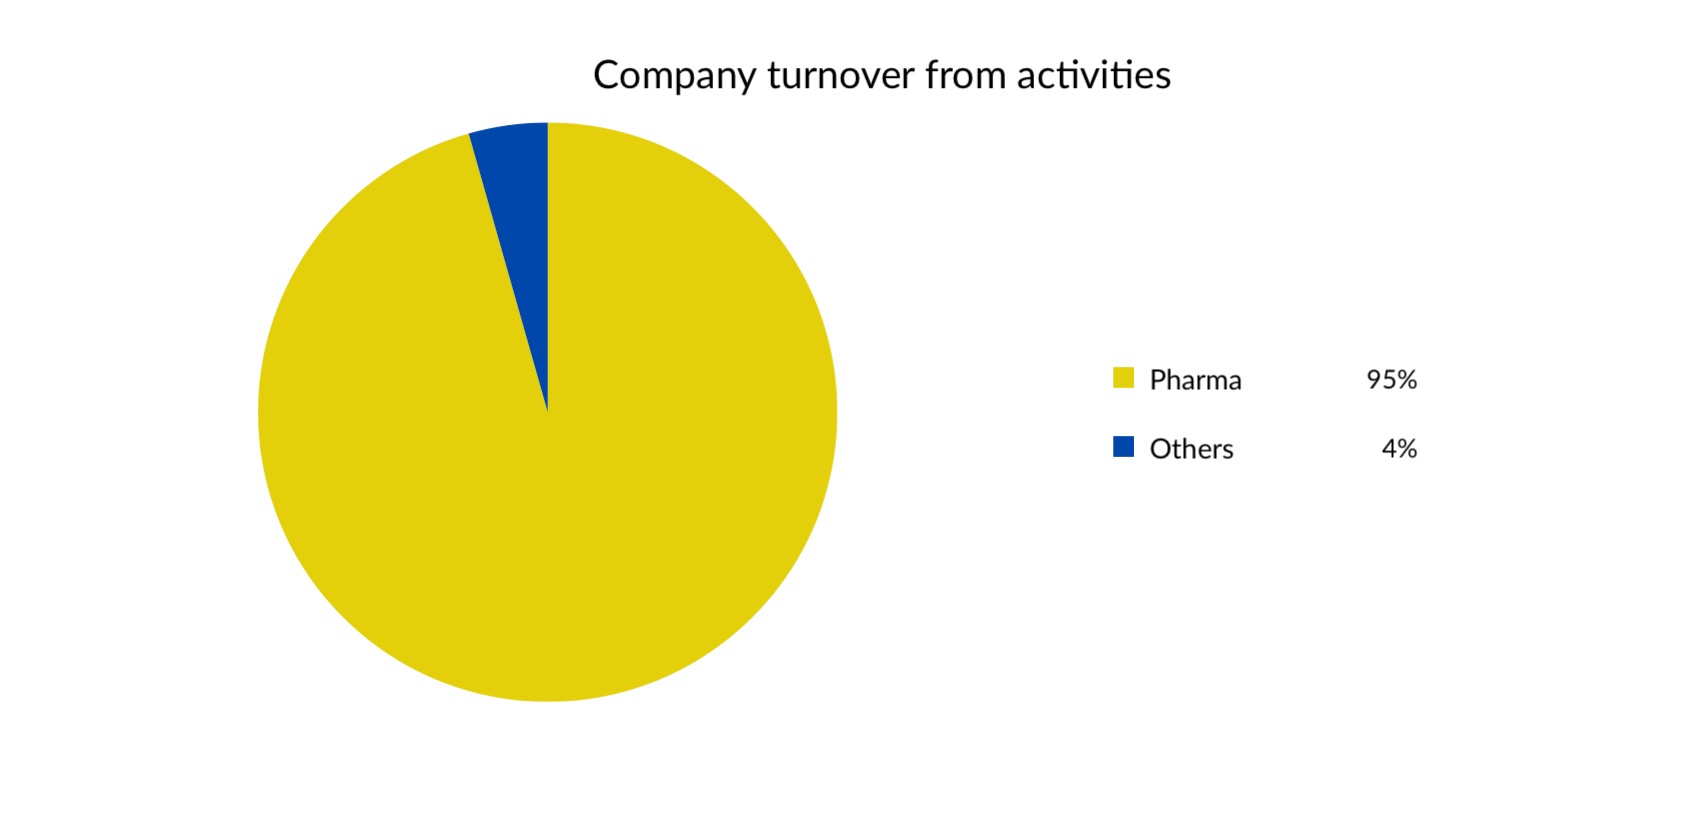
Business model
* Turnover from business activities -
* Geographically wise break up -

Fundamentals
1. Market cap - 35,911 crore
2. Balance sheet -

4. Debt to equity - 0.20
5. Interest coverage ratio - 35.57
6. P&L statement -

7. Cash flow to profit ratio - 0.67
8. Contingent liabilities - 270.8 crore
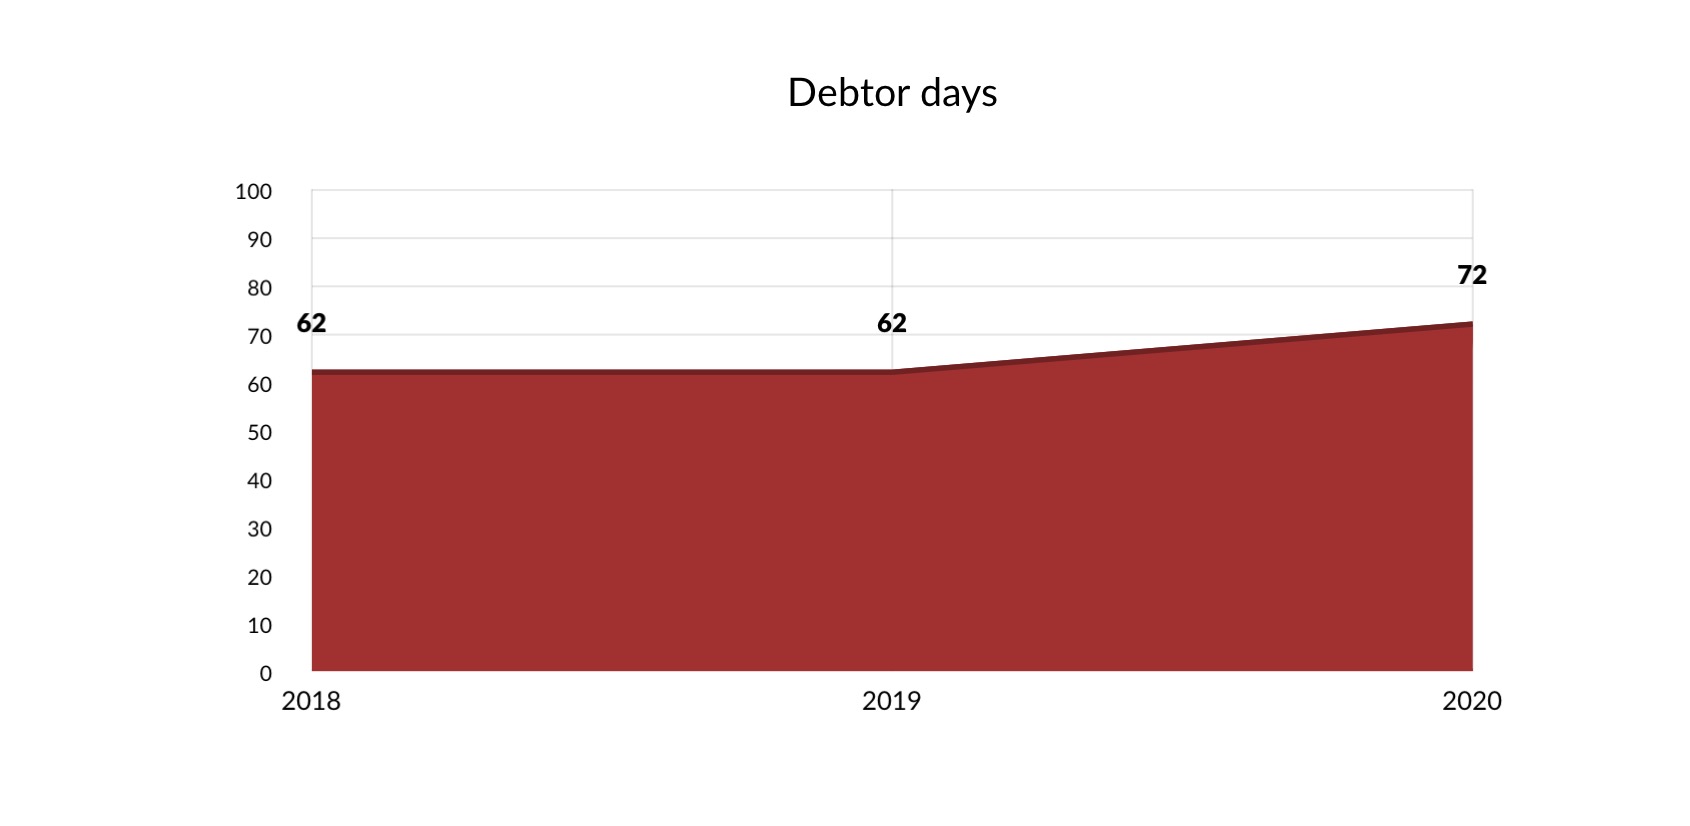
9. Debtor days -
* Sales Growth -

* Profit Growth -

* Share price Growth -

Valuation
* P.E ratio - 23
* Industry PE ratio - 27
* PEG ratio - 0.92
* P.B ratio - 5.08
* Intrinsic value formula(by Benjamin graham) -
₹ 7500
# intrinsic value formula:-(2*G + 8.5) * EPS
Where G stand for growth(5years)
EPS stand for earn per share
————————————————————————
Thank you for reading
I Like to add one more important thing here, The global Pharmerging Market size will grow by US$ 595.1 Billion by 2025 at a CAGR of 17.3% in the given forecast period.
ReplyDelete